

Operating Leverage Explained: How Fixed vs Variable Costs Drive Profit Volatility
What Is Operating Leverage?
Operating leverage sounds like complicated finance jargon, but it's a simple concept beneath all the noise. It’s all about how a company’s cost structure affects profit growth.
It can be used to understand how a change in revenue translates into operating income in percentage terms. In simple terms, operating leverage explains how small changes in revenue can lead to big swings in earnings.
The whole thing comes down to the cost base. In particular, it boils down to fixed costs vs. variable costs.
How Operating Leverage Works (Fixed vs. Variable Costs)
Every business deals with two types of costs. Fixed and variable.
Fixed costs don’t care whether you sell one unit or a million. They’re stubborn. Things like rent, equipment leases, and salaried employees. They’re on the books whether your revenue is booming or flatlining.
That bakery on the corner pays the same to lease its oven and storefront whether it pumps out 10 loaves or 100. This creates a break-even point. Sales need to hit a certain level before the business turns a profit.
Variable costs, on the other hand, scale with production. More units sold means more costs. Ingredients, packaging, shipping, and hourly wages. These all rise as you make and sell more. So if that same bakery bakes more loaves, it’ll spend more on flour, bags, and delivery.
Operating leverage is all about the balance between the two.
When fixed costs make up the bulk of expenses, you’ve got high operating leverage. That’s great if you can get past the break-even point.
Once you're there, every extra sale delivers a much fatter slice of profit, because your costs aren't climbing with your revenue. But if variable costs dominate, you’ve got low operating leverage. Sales growth still helps, but profits creep rather than spike, because expenses are tagging along for the ride.
More fixed costs = higher leverage = bigger profit swings when sales move.
More variable costs = lower leverage = smoother, but slower, gains.
Why Operating Leverage Matters to Investors
For investors, operating leverage is both an opportunity and a risk. That’s why it’s critical to understand a company’s degree of operating leverage (DOL), a concept we’ll dive further into.
When things are going well, high operating leverage is like strapping a jet engine to the P&L. Fixed costs are already paid, so every extra sale punches through to the bottom line with serious force. Net margins widen.
Earnings explode.
Revenue might be up 10%, but profit could be up 40%. If you’re right about a company entering a growth phase, high operating leverage can deliver outsized gains. Fast.
It’s how small revenue wins turn into monster EPS beats.
Flip the scenario, and it cuts the other way.
If demand drops, high fixed-cost businesses can’t easily downshift. Rent, leases, and salaries all keep eating away at that bottom line. That same leverage now turns against you.
Earnings can fall off a cliff.
A 10% sales decline might mean a 50% drop in profit. It’s brutal. These are the companies that look bulletproof during boom times and get steamrolled in downturns.
Investors have to tread carefully. High operating leverage means high volatility. Low-leverage firms aren’t as exciting, but they absorb shocks better.
Operating leverage tell. a lot about the kind of ride you’re in for. If you want rollercoaster thrills, go high. If you want a smoother cruise, go low. Either way, you need to know what kind of machine you’re climbing into.
Real-World Examples of Operating Leverage
Let’s look at three extreme examples to see operating leverage in action:
Auto Manufacturing: High Fixed Costs, Thin Margins
Car companies are the poster children for high operating leverage. Before they’ve sold a single car, they’ve already sunk billions into factories, machines, tooling, and payroll. These are all fixed costs.
Whether they pump out 10 or 10,000 cars, that overhead doesn't change much. Plant depreciation, long-term leases, and engineers on salary. These line items don’t flinch with volume.
Now layer in the fact that autos are a low-margin product. Materials, labour, and compliance are all expensive. Each sale leaves a relatively small chunk of profit. So what you’re left with is a business model that must scale to survive.
If XYZ Motors builds a state-of-the-art factory, it might break even at 10,000 cars. But if demand surges to 20,000?
Boom.
That same factory and team can crank out more cars without doubling costs, and margins expand. This is classic operating leverage. The more units you sell, the more profit gets squeezed out of every car, because the overheads are already covered.
But it swings both ways. If sales dip below break-even, those big fixed costs become an anchor. Idle plants, underutilised staff, and sunk infrastructure start eating into earnings fast.
That’s why auto stocks are cyclical. They explode in a boom and get hammered in a bust.
SaaS Companies: Low Cost, High Margin, Scalable Machines
Let’s look at software, a very different business. Specifically, the SaaS model.
Think cloud subscriptions. Tools like Xero, Salesforce, or Canva. These businesses are built almost entirely on fixed costs. The heavy lifting is upfront. Build the platform, hire developers, invest in servers. Once that’s done, the marginal cost of adding a new customer is close to zero.
There’s no manufacturing line, no inventory, no raw inputs. Just some server load and a bit of customer support.
So when a SaaS business grows from 1,000 users to 10,000, it doesn’t need ten times the team or infrastructure. Maybe just a bit more bandwidth and a few extra support reps. But revenue climbs steeply while costs barely nudge. The result is operating leverage through the roof.
A well-designed SaaS business becomes a cash firehose once it reaches scale.
Microsoft’s software division is a textbook case. Most of the cost is fixed. Writing code, maintaining cloud architecture. So every new sale is almost pure profit.
This is why SaaS stocks trade at premium valuations. Investors are betting that today’s high-margin subscription revenue will scale fast, with minimal incremental spend.
Compare that to something like Walmart. Sure, it moves volume, but every dollar of revenue requires buying more stock, paying more staff, more handling and logistics. Costs move in lockstep with sales, capping operating leverage and keeping margins tight.
Cleaning Company: Minimal Fixed Costs, Highly Variable
Now let’s look at a very different beast. A contract cleaning company.
These businesses typically operate with very low fixed costs. A small family-run cleaning business might not even need a central office. Just a phone, a website, a booking app, and a roster of cleaners.
There’s no warehouse, no plant, no massive payroll of salaried staff sitting around. The main cost is hourly wages.
Every job booked means paying someone to do the work. No job, no wage. The cleaners are paid per shift, and the cost scales almost one-to-one with the amount of work done.
Cleaning supplies are negligible, maybe a few bucks a job. So revenue and cost move together, step by step. That’s the hallmark of low operating leverage.
What does this mean in practice?
In slow periods, the business naturally shrinks its cost base. No need to pay staff if there’s no work.
But in busy times, profits don’t explode the way they might for a SaaS firm. Even if bookings triple, costs triple too. There’s no leverage boost. You're running hard just to keep your profit margin flat.
Cleaning companies are the kind of low-risk, low-reward model that suits certain investors. Predictable, but unlikely to suddenly scale into monster profits. It’s a volume game, and operating efficiency matters more than operating leverage.
Auto manufacturers, SaaS firms, and cleaning companies all have very different operating leverage profiles. One requires volume to survive, one thrives on scale, and one is almost all variable cost.
Low variable costs combined with a high fixed cost base can create some fantastic inflexion point trades as companies accelerate through breakeven points. These kinds of transitional periods are often misunderstood and mispriced by investors.
Operating Leverage in Action: Small Change, Big Difference
Let’s say two companies start off with the same profit of $6,000. But one is built on fixed costs (High OL), the other on variable (Low OL). Sales tick up 10%. They both start with the same revenue and the same net profit. But their cost structures are different, and that’s the whole point.
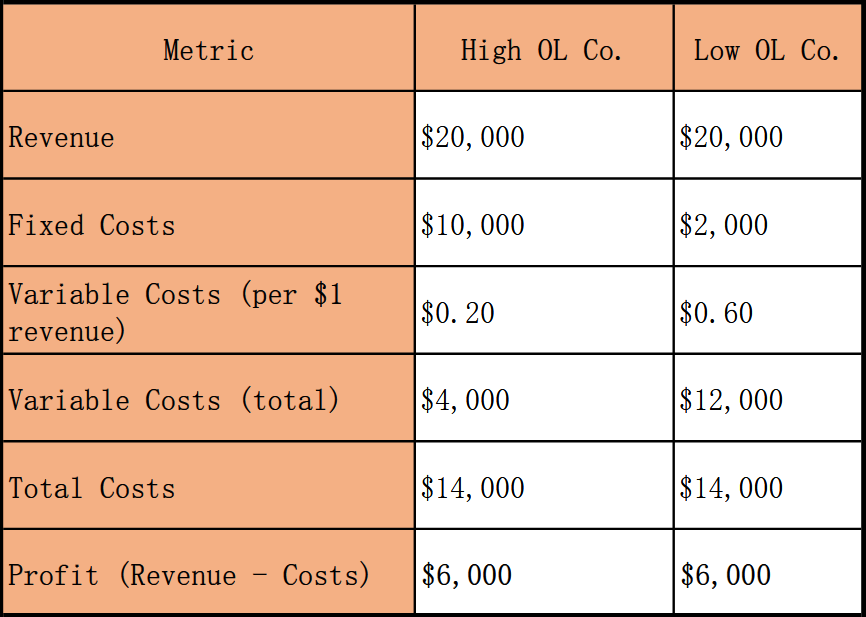
Example: Operating leverage baseline for two companies (Source: The Markets IQ)
So far, they look identical on the bottom line. But now we grow revenue by 10% and watch what happens.
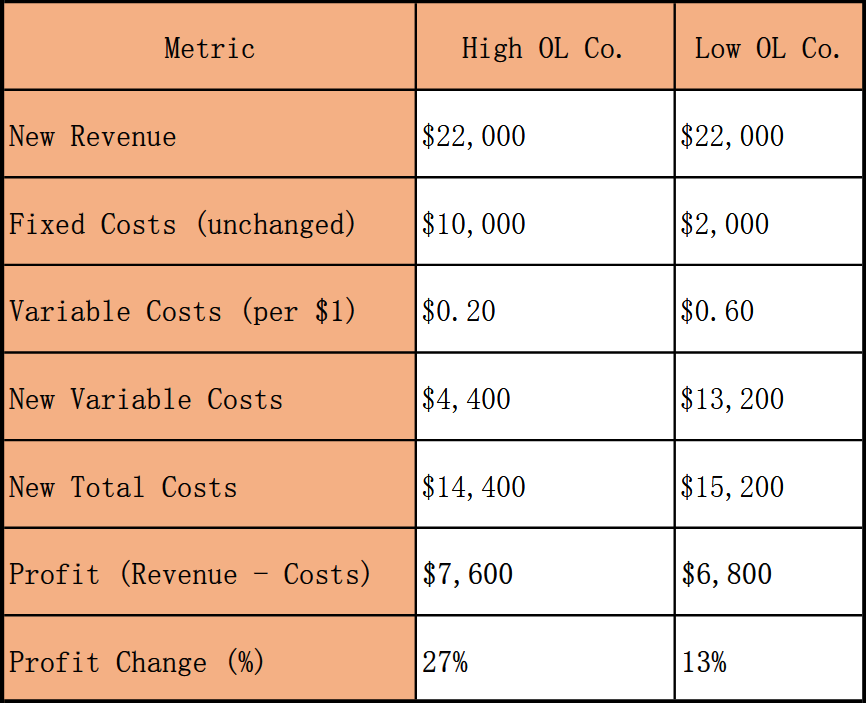
Example: Operating leverage 10% revenue growth for two companies (Source: The Markets IQ)
The High OL company sees profit leap to $7,600, up 27%. The Low OL firm only sees a $6,700, or a 13% lift.
The high fixed-cost company doesn’t need to spend much more to service the extra sales. It might be an SaaS company as we discussed above. It’s already paid for the infrastructure. The revenue just stacks.
Meanwhile, the Low OL company had to spend more to make more. Its variable costs went up with sales, weighing on profits.
High operating leverage magnifies profit swings. A small revenue beat becomes a big earnings jump. This is why operating leverage matters.
It’s an amplifier. It’s how 10% top-line growth becomes 30% bottom-line growth.
Or a bloodbath if sales fall.
How to Calculate the Degree of Operating Leverage (DOL)
One way to measure this effect is with the Degree of Operating Leverage (DOL).
The Degree of Operating Leverage (DOL) is a financial ratio that measures how sensitive a company’s operating income (EBIT) is to a change in sales.
It quantifies the concept of operating leverage as a number, so you can compare companies or track how a single company’s leverage changes over time.
DOL = % Change in Operating Profit ÷ % Change in Sales
It’s a simple formula that quantifies leverage. In our example:
High OL Co: 27% ÷ 10% = DOL of 2.7
Low OL Co: 13% ÷ 10% = DOL of 1.3
This tells us the high-leverage firm is twice as sensitive to revenue changes as the low-leverage one.
DOL gives you a concrete number to compare risk and reward between companies. A higher DOL means higher potential upside in booms, but also more danger in downturns.
How to Use Degree of Operating Leverage
- A DOL above 1 means the company is experiencing leverage. The further above 1, the more explosive (or risky) the earnings.
- A DOL close to 1 means operating profit and revenue are moving roughly in sync.
- A DOL below 1 (rare) can happen in cases where costs rise faster than revenue. This usually signals margin compression or diseconomies of scale.
Investors use DOL to:
- Forecast how earnings might behave in growth vs contraction scenarios
- Compare profit sensitivity between companies in the same industry
- Assess risk exposure in highly fixed-cost business models
How to Spot Operating Leverage as an Investor
Alright, so how do you actually use this? Here’s what to look for:
1. Examine the Cost Structure
Dig into the income statement. High gross margins, plus chunky fixed costs like R&D, depreciation, or salaried staff? That screams operating leverage.
You’re looking for expenses that don’t flex with sales. Those are your fixed costs. If most of the cost base scales with revenue (like COGS in retail), operating leverage is probably low.
2. Calculate the Leverage Effect
It doesn’t need to be fancy. Look at how operating profit has changed relative to sales. If revenue went up 10% and operating profit rose 15%, that’s a degree of operating leverage (DOL) of 1.5. Do this over a few years, and you’ll start to see how sensitive profits are to revenue moves.
3. Compare Within Industries
Operating leverage isn’t one-size-fits-all. Airlines, automakers, and steelmakers are all fixed-cost monsters. High operating leverage is the norm. Retailers, consultants, and food delivery are more variable cost-driven. So don’t just compare across sectors but benchmark within them. A SaaS firm with 85% gross margins and rising volume should look very different from a wholesaler dragging 15% margins and heavy logistics costs.
4. Match It to the Growth Outlook
Expecting a growth wave? High operating leverage is your friend. It will juice profit as sales scale. Worried about a slowdown? Better to be in a low operating leverage business that can shrink its cost base with falling revenue. This is where macro meets micro. Align your view of the cycle with the operating leverage profile of the business. Leverage is a sword. Wield it only when you think the tide is rising.
5. Listen for Signals
Management teams love to drop hints. ‘Scalable model’, ‘margin expansion with volume’, ‘fixed-cost absorption’, and ‘latent capacity’ all indicate operating leverage. Pay attention to capacity utilisation figures too. If a business runs at 60% of plant capacity, there’s room to scale without plant expansion. That’s leverage just waiting to be activated.
Operating leverage isn’t just an academic concept. It’s a real tool for forecasting and risk management. Two companies with the same revenue growth can post wildly different earnings trajectories. If you spot the one with higher operating leverage in a rising sales environment, you’re set up for an outsized return. If you miss it in a downturn, you’ll wear the losses hard. Know the structure, know the stakes.
Conclusion: Why Operating Leverage Is Your Edge
Operating leverage is one of those hidden forces that separates the good from the great.
And the steady from the volatile.
It’s not some abstract accounting trick. It’s the real-world impact of how a business is built. Fixed vs. variable costs. That’s it. That’s the whole game.
Heavy fixed-cost companies like automakers, airlines and miners are like pressure cookers. Once revenue heats up past a certain point, profits explode.
But in a downturn, that same leverage works against them. Idle plants, grounded planes, and debt-laced infrastructure all bleed profit hard.
On the flip side, software businesses and SaaS platforms are lean, scalable machines. They write the code once, then sell it a thousand times.
Their costs barely move while revenue scales. That’s why a 10% sales jump can turn into a 30–40% profit surge. It's operating leverage in beast mode.
For investors, this isn’t just nice to know.
It’s edge.
If you can read a P&L and understand which costs flex and which ones don’t, you can see what others miss. You’ll spot which companies are poised to crush it in a bull market.
And, which ones are exposed in a downturn.
Operating leverage is the amplifier. It turns modest growth into massive upside. It also turns headwinds into profit warnings.
It’s not magic. It’s math. And once you see it, you’ll never look at a set of financials the same way again.
- Operating Leverage
- DOL
- Degree of Operating Leverage